In Turku, temperature variations between heat islands and neighborhoods have been monitored for a long time. Information on the location and development of heat islands is crucial background knowledge for adapting to climate change.
Heatwave days have increased, and heatwaves have lengthened in Finland over the past decades. The climate of Southwest Finland has already warmed, as the period from 1991 to 2020 was approximately 0.6 °C warmer than the comparison period from 1981 to 2010.
Heat impacts densely populated cities the most, with high temperature heat islands forming in their centers. Buildings and streets absorb and store sunlight and waste heat from traffic and industry.
In Turku, temperature variations between heat islands and neighborhoods have been monitored for a long time. Information on the location and development of heat islands is crucial background knowledge for adapting to climate change.
Six different maps of Turku's temperature variations have now been added to the map service. You can browse the maps directly on the Turku guide map, or read more about them on this page.
Related content:

To adjust the map view, you can use the "Visible on map" menu in the lower right corner. The slider switch in the menu (horizontal bar) adjusts how transparent the underlying base map is compared to the color ranges that depict temperature variations.
- When the slider is on the left, the background map is less visible, making the color areas more pronounced.
- With the slider switch on the right, the floor map is more clearly visible and you can more easily identify places such as streets or buildings.
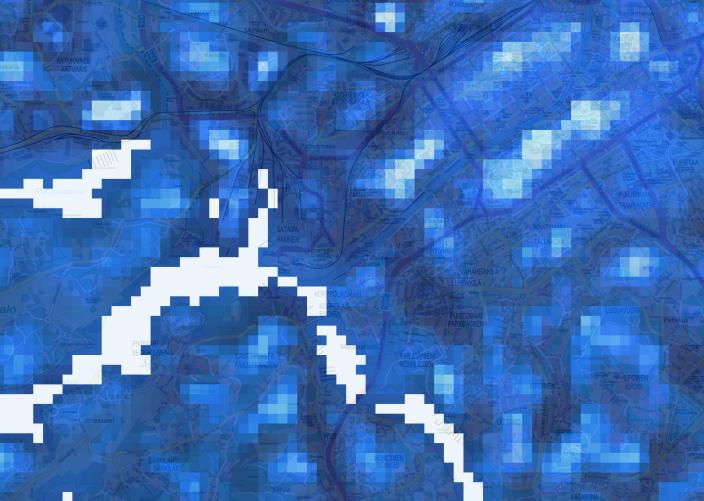
Large Temperature Differences on a Calm February Frost Night
Map showing regional temperature differences in Turku on a calm, clear night, February 28, 2006, at 1:30 AM, when the sea was largely frozen.
Open the data in the Turku map service
The map colors represent regional temperature variations in Turku during a winter night. This information can be useful for estimating regional heating needs.
The map depicts the situation of a surface inversion on a calm, cloudless February night in 2006 at 1:30 AM. Temperatures varied regionally by nearly 20 degrees. The map is modeled based on measured temperature observations.
In a surface inversion, the ground and the air close to it cool rapidly because the cloud cover does not prevent heat radiation from escaping into space. As a result, colder air remains beneath warmer air near the ground. This is unusual, as temperature typically decreases with altitude. Inversion thus refers to the opposite of the usual temperature distribution.
Regional temperature differences also arise under calm conditions, when cold, heavy air slowly drains into lower-lying areas. The map reveals the formation of so-called cold air lakes in these low areas, while hills stand out as warmer regions compared to their surroundings.
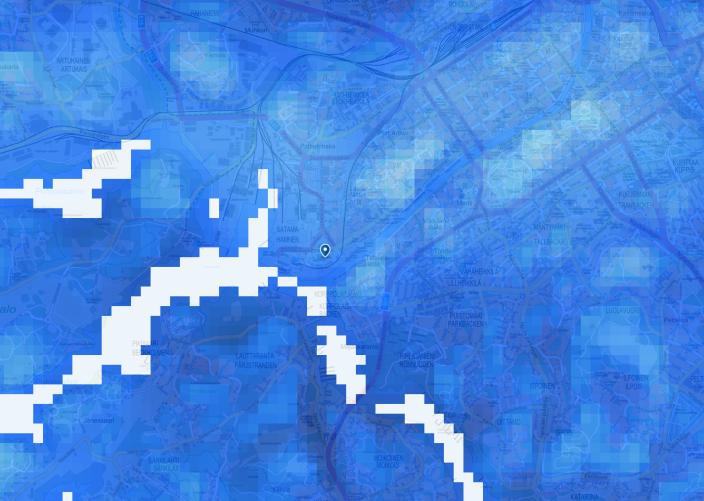
Regional Temperature Variations on a Cold February Morning
The average temperature at the TURCLIM weather observation network measurement points on February 7, 2007, at 8:00 AM was −25.7°C. This is the lowest average temperature during the period from January 1, 2006, to December 31, 2007.
Open the data in the Turku map service
The map shows regional temperature variations in Turku during a winter frost morning. This information can be useful for estimating regional heating needs.
The map shows the situation at 8 AM on a February morning in 2007, when the temperature was below −20°C across the entire study area. The map is modeled based on measured temperature observations. At the time of measurement, an urban heat island effect was present in Turku's city center, primarily due to heat loss from buildings and the warming effect of traffic.
In addition to the city center, areas along the coast and in the archipelago were warmer than their surroundings, which can be explained by the warming effect of water bodies. Despite the ice cover, some of the water's heat transferred through the ice, warming nearby areas. The coldest temperatures were found in the inland low-lying and sparsely populated areas, where heavy, cold air easily forms so-called cold air lakes.
Early Summer Daytime Temperature Differences
Map depicting midday temperatures on June 13, 2006, at 12 PM, showing warmer inland areas and cooler coastal zones due to cold sea temperatures.
Open the data in the Turku map service
The map colors represent temperature differences between the coast and inland areas during midday in early summer 2006, when sea temperatures were still cool. Information on regional temperature differences can be used, for example, to map suitable growing locations for spring plants sensitive to temperature conditions.
The map depicts the midday situation on June 13, 2006, at 12:00 PM, when the sea water was still quite cool from the winter. The map is modeled based on measured temperature observations.
The map shows the cooling effect of the cold sea water along the coastal zone, particularly in the western parts of Hirvensalo and Ruissalo islands. The temperature difference between the archipelago and the inland was nearly ten degrees.
The wind during the day mixes the air masses, which is why the fine-scale temperature variations and the urban heat island effect are not as clearly visible as at night (compared to situations 4 and 5).
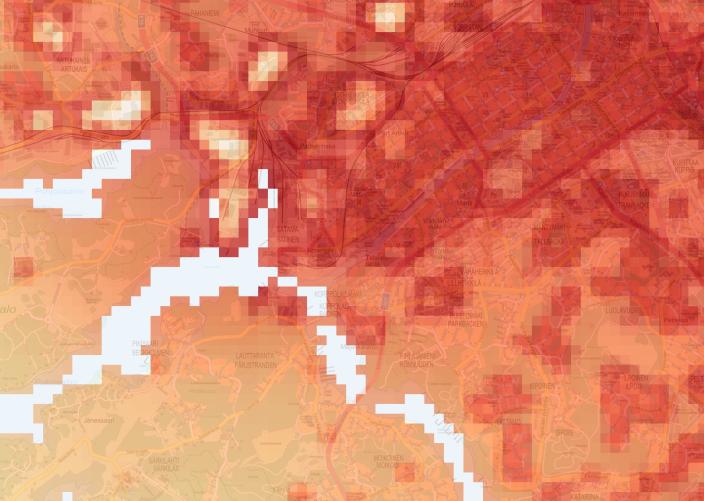
Nocturnal Urban Heat Islands during July Heatwave
The map shows nighttime temperatures measured across different parts of Turku at 2 AM during the period July 25–31, 2018. In Finland, the continuous July 2018 heatwave lasted for 25 days.
Open the data in the Turku map service
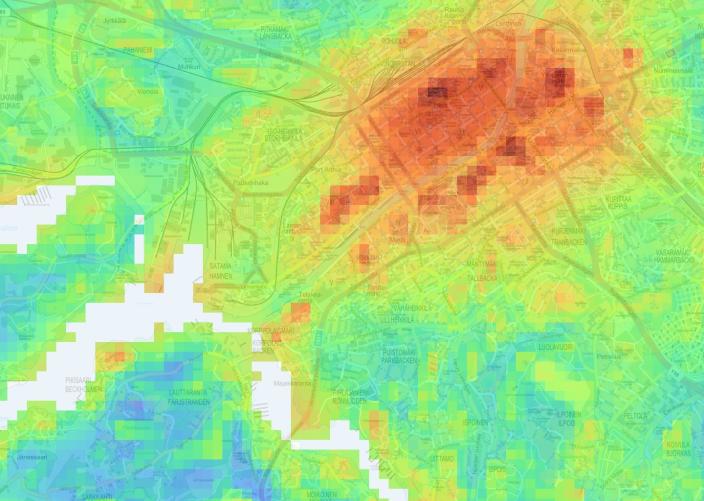
During the heatwave depicted on the map, the highest temperatures were observed in Turku's city center, suburbs, and south-facing rocky outcrops. Information on temperature differences can be used, for example, to assess regional variations in health risks caused by high temperatures.
The map shows observed and modeled temperatures at 2 AM during the heatwave from July 25–31, 2018. The urban heat island effect refers to the temperature difference between the densely built city center and its surroundings. It is most pronounced at night, in this case about four degrees Celsius. The average temperature in Turku during July 2018 was 3°C higher than the average July temperature for the period 1991–2020.
The urban heat island forms when sun-heated surfaces like asphalt, building walls, and other heat-retaining structures release stored heat energy into the surrounding environment during the day.
The heat island effect is strongest at night, even though high temperatures can also be measured during the day. This is because daytime air currents caused by solar heating tend to equalize temperature differences between areas.
During the heatwave depicted on the map, high temperatures were observed in Turku's city center, suburbs, and south-facing rocky outcrops. Vegetated areas appeared cooler on the map. River valleys were particularly cool due to the formation of so-called cold air lakes on calm nights, as cool and heavy air settles into lower-lying areas.
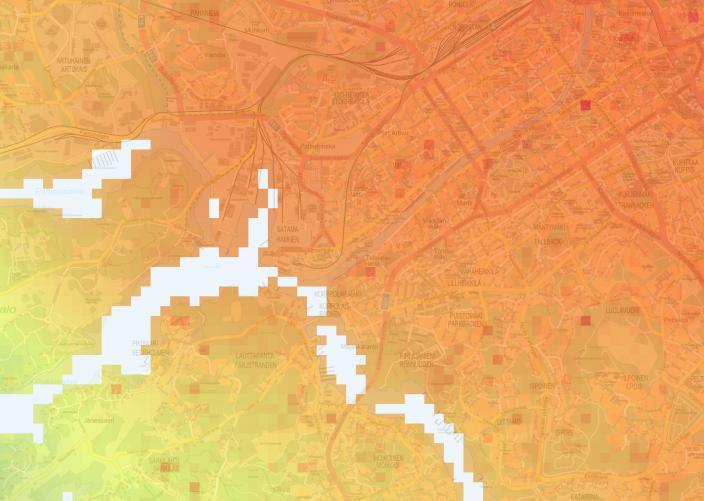
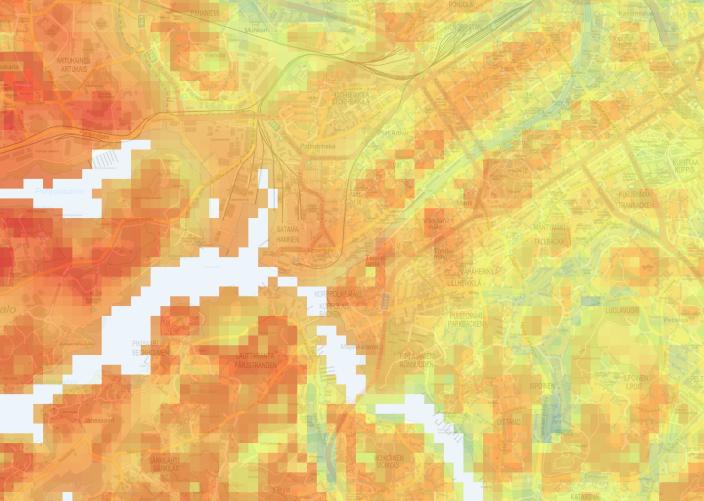
Regional Temperature Variations on an August Heat Day
The highest average temperature at the TURCLIM weather observation network measurement points during the period from January 1, 2006, to December 31, 2007, was 29°C. It was measured on August 6, 2006, at 3:30 PM.
Open the data in the Turku map service
The map illustrates regional temperature differences in Turku on a hot August afternoon in 2006. This information can be useful for assessing regional health risks due to high temperatures.
The map depicts the situation on the afternoon of August 6, 2006, at 3:30 PM, when the temperature was above the heat threshold across the entire study area. The map is based on a model created from measured temperature observations.
At that time, a weak urban heat island effect was present in the center of Turku, and smaller heat islands were also observed in densely built areas outside the city center. The temperature increased from the coast towards the inland due to the cooling effect of the sea, as the sea surface temperature was lower than the air temperature. The heat islands in Turku's city center and other densely built areas were caused by the warming of building materials.
In some heat islands outside the city center, the center of the heat island was cooler than its surroundings. This was due to the fact that large buildings warmed up more slowly than their surroundings during the day.
Regional Temperature Differences on a Cool September Morning
The map depicts the early morning situation of September 20, 2007, at 3:00 AM, when the surface water temperature was higher than the air temperature.
Open the data in the Turku map service
The map’s colors represent regional temperature differences in the Turku area on the early morning of September 2007, when the air temperature was lower than the surface water temperature. This information can be useful, for example, when mapping suitable growth areas for vegetation sensitive to temperature conditions.
The map depicts regional temperature differences at 3:00 AM on a September night in 2007. The map is modeled based on measured temperature observations.
Along the coast, industrial areas and high hills near water bodies were warmer than their surroundings. This was due to the fact that the water surface temperature was higher than the air temperature.
The warmth in industrial areas can be explained by solar radiation energy stored during the day and heat loss from buildings. The warmth of elevated areas and the coolness of low-lying areas can be explained by an inversion situation, where cold air flows as a heavier mass into the lower areas.
These maps were created by modeling temperature data from the University of Turku’s TURCLIM weather observation network, combined with open geospatial datasets. The same data and modeling methods are detailed in the following scientific articles:
- Extreme urban–rural temperatures in the coastal city of Turku, Finland: Quantification and visualization based on a generalized additive model
- Comparison of Physically Based and Empirical Modeling of Nighttime Spatial Temperature Variability during a Heatwave in and around a City
These map representations were specifically produced for this purpose and they differ from the maps presented in the aforementioned scientific article in terms of source data, regional boundaries, and color scheme.
Materiaalit ovat tuotettu osana Euroopan aluekehitysrahaston osarahoittamaa Ilmastonkestävät investointihankkeet - Alueellisiin ilmastoriskeihin varautuminen kaupungin kaavoituksessa ja suunnittelussa (IKI) -hanketta.